
A sample statistic is a number that describes a small group taken from a larger group. The small group is the sample. The larger group is the population. You calculate the statistic from the sample data to estimate something about the whole population. For example, if you ask 200 people in your city about their favorite food, the average answer from those 200 people is a sample statistic. You use it to guess what the entire city prefers.
What Is A Sample Statistic Definition And Examples in Plain Language?
A sample statistic is any number you compute from data you actually collected. That data comes from a subset of a larger group. The key point is scale. You are not measuring everyone. You are measuring a slice and using that slice to make a smart guess about the whole pie.
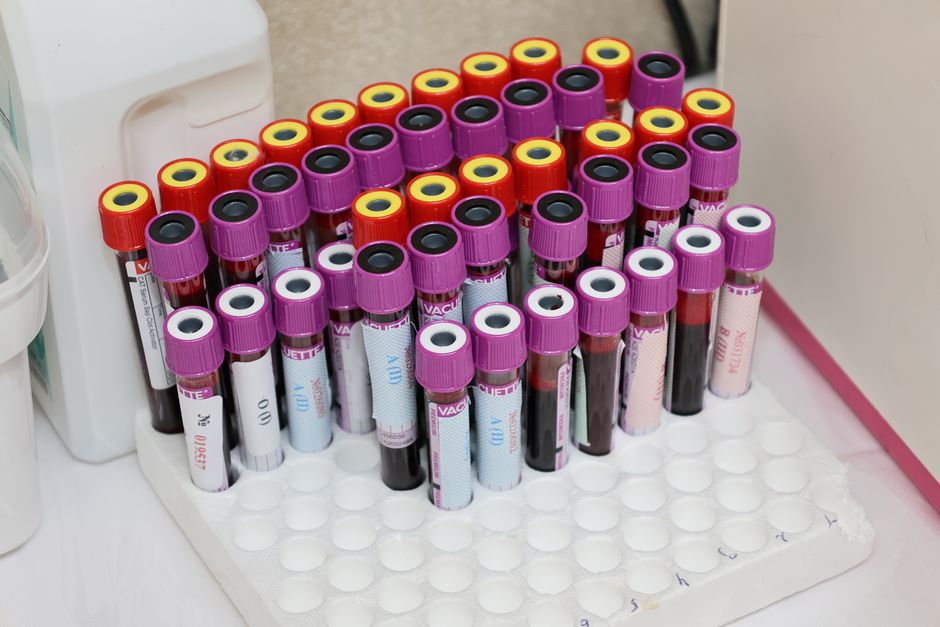
Think about a blood test. A doctor does not drain all your blood to check your cholesterol. They take a small vial. The vial is the sample. The cholesterol number from that vial is the sample statistic. It represents your overall blood health without testing every drop.
The word “statistic” can feel technical, but it simply means “a number calculated from data.” When that number comes from a sample, it is a sample statistic. When it comes from the entire population, it is called a parameter. That difference matters because samples always carry some uncertainty.
Why Does the Difference Between Sample and Population Matter?
The entire group you care about is the population. It could be all adults in the United States. It could be every apple in one orchard. It could be all patients with a specific condition. Measuring everyone is often impossible, expensive, or simply too slow.
That is why researchers use samples. They measure a smaller group carefully and then use statistics to estimate the population value. The population value is the true number. The sample statistic is your best educated guess at that true number.
Here is the catch. No sample is perfect. If you sample 100 people, you get one average. If you sample a different 100 people, you might get a slightly different average. This natural variation is called sampling error. It is not a mistake. It is just the reality that a sample is not the whole population.
A larger sample usually gives a more accurate estimate. But even large samples can be wrong if they are not representative. A sample that includes only one age group or one neighborhood will not reflect the whole population well, no matter how many people you ask.
Common Types of Sample Statistics You Already Use
You encounter sample statistics more often than you realize. News reports, product reviews, and medical studies all rely on them. Here are the most common types.
- Sample mean. This is the average. Add up all the values in your sample and divide by the number of values. If five friends weigh 150, 160, 170, 180, and 190 pounds, the sample mean is 170 pounds.
- Sample proportion. This is a percentage. If 40 out of 100 surveyed people say they exercise daily, the sample proportion is 40 percent.
- Sample standard deviation. This measures how spread out the data is. A small standard deviation means the values cluster close to the average. A large one means they vary widely.
- Sample median. This is the middle value when you line up all data points from smallest to largest. It is useful when a few extreme values would distort the average.
- Sample range. This is the difference between the highest and lowest values in your sample.
Each of these gives you a different piece of information. The mean tells you the center. The standard deviation tells you the spread. The proportion tells you the share of a category. Researchers often report several statistics together to give a fuller picture.





Real-World Examples of Sample Statistics
Political polls are a classic example. Pollsters cannot ask every registered voter whom they support. Instead, they survey a few thousand people. The percentage who say they support a candidate is a sample statistic. News organizations then use that number to estimate the true support among all voters.
Quality control in factories works the same way. A manufacturer cannot test every light bulb that comes off the line because testing destroys the bulb. Instead, they test a random batch. The failure rate in that batch is a sample statistic. It estimates the failure rate for the entire production run.
Medical research relies heavily on sample statistics. A study on a new drug enrolls a few hundred or few thousand patients. The average improvement in those patients is a sample statistic. Researchers use it to estimate how the drug would work in the broader population of patients with that condition.
Even online shopping uses this concept. When a website shows “4.5 out of 5 stars based on 2,000 reviews,” that 4.5 is a sample statistic. It summarizes the opinions of people who reviewed the product, not everyone who bought it.
How Sampling Error Affects the Accuracy of a Sample Statistic
Sampling error is the difference between your sample statistic and the true population parameter. It exists because you only measured part of the group. You can reduce it, but you can never eliminate it completely.
Sample size is the biggest factor. A sample of 1,000 people will give a more precise estimate than a sample of 100 people. This is why credible polls typically survey at least 1,000 people. Smaller samples produce wider margins of error.
The margin of error is a formal way to express this uncertainty. If a poll says 52 percent of voters support a candidate with a margin of error of plus or minus 3 percent, the true support is likely between 49 and 55 percent. This range is called a confidence interval.
A confidence interval of 95 percent means that if you repeated the sampling process many times, 95 out of 100 intervals would contain the true population value. It does not mean there is a 95 percent chance the true value is in this specific interval. That distinction is subtle but important for interpreting results correctly.
Sampling method matters just as much as sample size. A random sample where every person has an equal chance of being chosen is the gold standard. Convenience samples, like asking people at a mall, are easier but less reliable. They tend to overrepresent certain groups and miss others.
Sample Statistic vs. Population Parameter: The Key Distinction
A parameter is a number that describes the entire population. A statistic describes a sample. The symbols used in statistics reflect this difference. Greek letters like mu and sigma represent parameters. Roman letters like x-bar and s represent sample statistics.
You almost never know the true parameter because measuring everyone is impractical. You use the sample statistic as your estimate. The entire field of inferential statistics is built on this idea. You take what you know from a sample and make educated inferences about the population.
Here is a practical example. The average height of all adult women in the United States is a parameter. To find it exactly, you would have to measure every adult woman. Instead, researchers measure a representative sample. The average height in that sample is the sample statistic. They then use it to estimate the population parameter.
This distinction matters when reading research. A study might report that a sample of patients showed a 20 percent improvement. That does not guarantee the entire population will see the same improvement. The statistic is an estimate, not a certainty.
Frequently Asked Questions
What is the difference between a sample statistic and a population parameter?
A sample statistic describes a subset of a group, while a population parameter describes the entire group. Researchers use the statistic to estimate the unknown parameter.
How do you calculate a sample statistic?
You calculate it directly from the data you collected in your sample. The calculation depends on which statistic you need, such as the mean, proportion, or standard deviation.
Why is a sample statistic not exactly equal to the population value?
Because you only measured part of the population, not all of it. This creates sampling error, which is the natural difference between the sample result and the true population value.
Can a sample statistic be biased?
Yes. If the sample does not fairly represent the population, the statistic will be systematically off. This is called sampling bias, and it cannot be fixed by simply increasing the sample size.
