

An A1C of 7% corresponds to an estimated average glucose of about 154 mg/dL. An A1C of 6% matches an average glucose of roughly 126 mg/dL, and an A1C of 8% lines up with about 183 mg/dL. These pairs come from a formula that researchers built by comparing A1C readings with continuous glucose measurements in thousands of people.
That formula is the eAG, short for estimated average glucose. It is the number some lab reports now print next to your A1C result. The word “estimated” matters. A single A1C cannot tell you what your blood sugar was at any one moment, and two people with the same A1C can have very different daily glucose patterns.
What Is The A1C For An Average Glucose Of 154 mg/dL?
An average glucose of 154 mg/dL works out to an A1C of about 7%. That pairing is not a coincidence — it falls almost exactly on the line that defines the eAG formula.
The relationship between A1C and average glucose is not a straight line. It is curved. Small changes at the low end of the range shift the A1C less than the same change at the high end. This is one reason a single conversion number can mislead if you treat it as exact.
Hemoglobin A1C is a measure of how much glucose has attached to hemoglobin in your red blood cells. Red blood cells live about three months, so the test reflects glucose exposure over roughly the previous two to three months. More glucose in the blood means more of it sticks to hemoglobin.
How Do You Convert A1C To Average Glucose?
The conversion uses a published equation. The most widely used version is: eAG (in mg/dL) = 28.7 × A1C − 46.7. This came from a study that pooled data across multiple centers and compared lab A1C values against continuous glucose monitoring in people with and without diabetes.
Here is what that equation produces at common A1C levels.
| A1C (%) | Estimated Average Glucose (mg/dL) |
|---|---|
| 5% | 97 |
| 6% | 126 |
| 7% | 154 |
| 8% | 183 |
| 9% | 212 |
| 10% | 240 |
These figures are estimates, not measurements. The original study found that individual results varied around the predicted value. That means your true average glucose could sit somewhat above or below the number your lab prints.
Why Doesn’t My Meter Average Match My A1C?
This is one of the most common frustrations in diabetes care, and it has several real explanations. The eAG is a population-level estimate, so it will not match everyone perfectly.
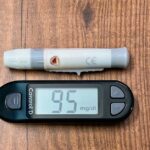
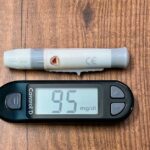
Timing is a big factor. A1C reflects roughly the last two to three months. If you check your meter heavily in the two weeks before a lab draw, your meter average reflects that recent window, not the full period. Recent changes in your routine can push the two numbers apart.
Other factors can also shift the A1C reading itself:
- Conditions that change red blood cell lifespan, such as some anemias, can make A1C read falsely high or low.
- Recent blood loss or blood transfusions can affect the result.
- Some hemoglobin variants interfere with certain A1C testing methods.
- Kidney disease and some other chronic conditions can alter red blood cell turnover.
When A1C and glucose data disagree, clinicians often lean on the glucose data. A meter or continuous monitor shows the actual pattern. The A1C shows the big picture. Neither replaces the other.



What Does A1C Mean If You Don’t Have Diabetes?
For people without diabetes, A1C is used mainly as a screening and risk tool. The widely used categories are:
- Below 5.7% is considered normal.
- 5.7% to 6.4% is classified as prediabetes.
- 6.5% or higher on two separate tests is a common threshold for diagnosing diabetes.
These cutoffs are standard in US clinical practice. They are not perfect dividers. Risk rises across the range, so someone at 5.6% is not in the same position as someone at 4.8%, even though both fall under “normal.”
A1C is not the only test used to diagnose diabetes. Fasting glucose and the oral glucose tolerance test are also used, and sometimes they disagree with A1C. A person can have a normal A1C but abnormal fasting glucose, or the reverse.
Does A1C Capture Blood Sugar Spikes?
No. This is the most important limitation of the test. A1C reflects average exposure, not the shape of your glucose curve.
Two people can share an A1C of 7% with very different daily lives. One might run fairly steady glucose with modest rises after meals. The other might swing from low to high repeatedly. The A1C looks identical. The experiences do not.
That gap matters because glucose variability itself is studied as a separate factor from average glucose. Whether variability carries independent risk beyond the average is an active area of research, and the evidence is not settled. What is clear is that A1C alone cannot show you how often you go high or low.
This is where continuous glucose monitoring adds information A1C cannot provide. It shows time in range, time above range, and time below range. For many people managing diabetes, those measures now guide treatment alongside A1C.
How Accurate Is The A1C To Average Glucose Conversion?
The conversion is reasonably accurate across groups of people. It is less accurate for any one individual. That distinction is the whole story.
The equation was derived from pooled data, so it describes the average relationship. Around that average, individual values scatter. Some people consistently run higher average glucose than their A1C predicts. Others run lower.
There is also the matter of what “average glucose” means in the original data. Much of it came from continuous monitoring, which samples glucose frequently but still does not capture every minute. The estimate is built on measurements, and measurements carry their own limits.
For practical purposes, the eAG is a useful translation. It helps people connect a lab number to the daily readings they see. It is not a precise readout of your personal glucose history.
What Should You Take Away From The Number?
The A1C and its matching average glucose are two views of the same underlying biology. The A1C is the summary. The average glucose is the same summary expressed in units you see on a meter.
Neither tells you what to do. A number is information, not a plan. How it fits into your care depends on your history, your other test results, and what your clinician sees across your full picture.
If your A1C and your meter data do not line up, that is worth raising. It is not a sign that one of them is wrong. It usually means they are measuring different windows of time, or that something is affecting your red blood cells. Either way, it is a conversation, not a verdict.
Frequently Asked Questions
What is the A1C for an average glucose of 154 mg/dL?
An average glucose of 154 mg/dL corresponds to an A1C of about 7%. This comes from the standard eAG equation used to convert between the two.
What is the A1C for an average glucose of 126 mg/dL?
An average glucose of 126 mg/dL corresponds to an A1C of about 6%. That A1C sits in the prediabetes range of 5.7% to 6.4%.
Is estimated average glucose the same as my meter average?
No. The estimated average glucose is a population-level estimate based on your A1C, while your meter average reflects only the times you actually tested. They often differ, especially if you check more often at certain times of day.
Can A1C be inaccurate?
Yes. Conditions that change red blood cell lifespan, such as some anemias, recent transfusions, or certain hemoglobin variants, can make A1C read falsely high or low. When results seem off, glucose monitoring often gives a clearer picture.
