
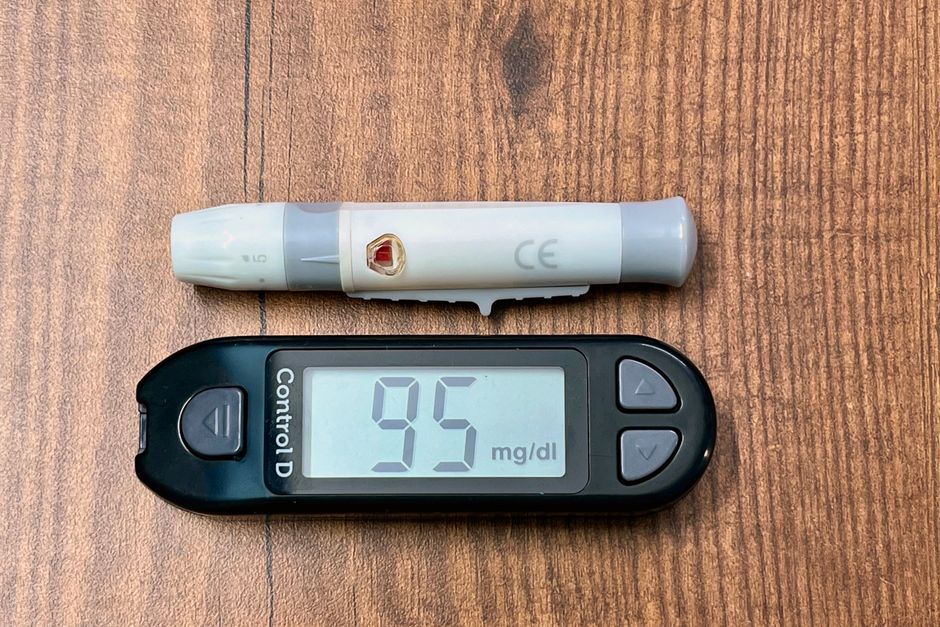
A normal glucose graph is not a flat line. It is a gentle wave that rises after you eat and settles back down within a couple of hours. For most healthy adults, that wave stays between roughly 70 and 140 mg/dL across the day. The exact shape depends on what you ate, how active you were, and your own unique biology.
If you have ever worn a continuous glucose monitor, or watched someone else’s numbers scroll by on a phone screen, you know the graph can look messy. Spikes, dips, small bumps overnight. That messiness is normal. What matters is the overall pattern, not any single reading.
What Does A Normal Glucose Graph Look Like?
A normal glucose graph shows a baseline that stays fairly steady between meals, punctuated by post-meal rises that peak and then fall. Fasting glucose in a healthy adult typically sits between 70 and 99 mg/dL. After a meal, it usually peaks somewhere under 140 mg/dL and returns toward baseline within about two hours.
On a continuous glucose monitor, which measures glucose in the fluid just under the skin rather than in blood, the numbers tend to run slightly lower than a fingerstick reading. They also lag behind blood glucose by a few minutes. That is a technical detail, not a sign something is wrong.
The shape of the curve matters more than any single point. A graph that rises smoothly and comes back down is doing what it should. A graph that stays elevated for hours, or bounces erratically, tells a different story.
What Happens to Blood Sugar After You Eat?
When you eat carbohydrates, your digestive system breaks them into glucose, which enters the bloodstream. The pancreas releases insulin in response. Insulin acts like a key, allowing glucose to move out of the blood and into cells for energy or storage.
This process usually brings glucose back down within one to two hours in a person without diabetes. The peak itself typically happens somewhere between 30 and 60 minutes after the first bite, though this varies with the meal and the person.
Several things change the height and width of that post-meal peak:
- How much carbohydrate the meal contained
- Whether the carbs came with fat, protein, or fiber, which slow absorption
- How much you moved before or after eating
- How well your body responds to insulin
- Time of day, since many people are more insulin resistant in the morning
One thing worth knowing: the same meal can produce different glucose curves in two different people. Research using continuous monitors has shown wide variation in individual responses to identical foods. That is why a cookie-cutter “good” glucose graph does not really exist.
What Do the Numbers on a Glucose Graph Mean?
Blood glucose numbers fall into ranges that clinicians use to classify fasting and post-meal readings. These ranges come from widely accepted diagnostic criteria used by major medical organizations.
| Category | Fasting Glucose | 2 Hours After Eating |
|---|---|---|
| Normal | 70–99 mg/dL | Less than 140 mg/dL |
| Prediabetes | 100–125 mg/dL | 140–199 mg/dL |
| Diabetes | 126 mg/dL or higher | 200 mg/dL or higher |
These thresholds apply to standardized testing, not to random readings from a monitor. A single high number on a CGM does not diagnose anything. Diagnosis requires proper testing, often repeated, interpreted by a clinician.
For people with diabetes, target ranges are different and are set individually with a doctor. The numbers above describe screening and diagnosis in people who are not already being treated for diabetes.


Why Does the Graph Rise and Fall the Way It Does?
The rise-and-fall pattern reflects a feedback loop between the pancreas, the liver, and your cells. Insulin lowers glucose. Glucagon, another pancreatic hormone, raises it when levels drop too low. Between meals, the liver releases small amounts of glucose to keep your brain and muscles supplied.
That is why a normal graph is never flat. Even during sleep, glucose drifts gently. Small overnight rises are common and usually harmless.
When the loop works well, glucose stays inside a fairly narrow band. When insulin resistance develops, cells respond less to insulin, so the pancreas has to work harder. The graph starts to show higher peaks and slower returns to baseline. This can happen years before fasting glucose crosses into the prediabetes range.
This is one reason continuous monitoring has drawn interest. It can reveal patterns that a single fasting blood draw misses. Whether that earlier information translates into better long-term outcomes is still being studied. The evidence there is not yet settled.
What Makes a Glucose Graph Look Abnormal?
An abnormal graph tends to show one or more of the following: fasting glucose consistently above 100 mg/dL, post-meal peaks that stay above 140 mg/dL for extended periods, or wide swings that do not settle.
Several conditions can produce a graph like that. Prediabetes and type 2 diabetes are the most common. Type 1 diabetes, which involves an immune attack on insulin-producing cells, produces a very different picture and typically comes on quickly. Other causes include certain medications, hormonal conditions, and acute illness.
It is worth being clear: a graph alone cannot tell you which of these is happening. The pattern narrows the possibilities, but diagnosis requires blood tests and clinical evaluation.
Some people without diabetes also see higher peaks than expected. Sleep deprivation, stress, illness, and certain medications can all push glucose up temporarily. One unusual day on a monitor is not a diagnosis.
Does Everyone’s Normal Graph Look the Same?
No. Normal covers a range, not a single curve. Age, genetics, body composition, activity level, and menstrual cycle phase all shift the pattern. Some healthy people peak at 110 mg/dL after a meal. Others peak at 135. Both can be normal.
There is also meaningful day-to-day variation within the same person. The same breakfast on two different mornings can produce two different curves. This is expected, not a sign that something changed.
Continuous glucose monitors were originally built for people with diabetes. Their use by people without diabetes has grown quickly, and the data can be genuinely useful for spotting patterns. It can also cause anxiety over normal fluctuations that have no clinical meaning. A rising line after a banana is not a medical event.
If you are using a monitor without diabetes and something in the pattern concerns you, the useful next step is a conversation with a clinician, not a change in diet based on a single reading.
When Should You Talk to a Doctor About Your Glucose Graph?
Talk to a clinician if you see fasting readings consistently at or above 100 mg/dL, post-meal readings that regularly exceed 140 mg/dL, or symptoms like unusual thirst, frequent urination, blurred vision, or unexplained weight loss.
Those symptoms plus high readings warrant prompt attention. They can indicate diabetes that needs treatment.
For most people without symptoms, routine screening is the more practical route. Major medical organizations generally recommend glucose screening starting in adulthood, with frequency based on risk factors such as age, weight, family history, and blood pressure. Your doctor can tell you what interval makes sense for you.
A graph from a monitor is a tool, not a verdict. It shows patterns. It does not diagnose. The interpretation belongs with a clinician who can look at the whole picture.
Frequently Asked Questions
What is a normal blood sugar level throughout the day?
For most healthy adults, fasting glucose falls between 70 and 99 mg/dL, and post-meal levels usually stay under 140 mg/dL. Readings drift within that range across the day, and small fluctuations are expected.
Should blood sugar be a flat line on a glucose monitor?
No. A flat line is not the goal and is not typical in people without diabetes. Normal glucose rises after meals and settles back down, creating a gentle wave rather than a straight line.
How soon after eating should blood sugar return to normal?
In most healthy adults, glucose returns close to baseline within about two hours after a meal. The exact timing depends on the meal’s composition and the person’s insulin response.
Can a continuous glucose monitor diagnose diabetes?
No. Diagnosis requires standardized blood tests interpreted by a clinician. A monitor can show patterns, but it is not a diagnostic tool on its own.
