
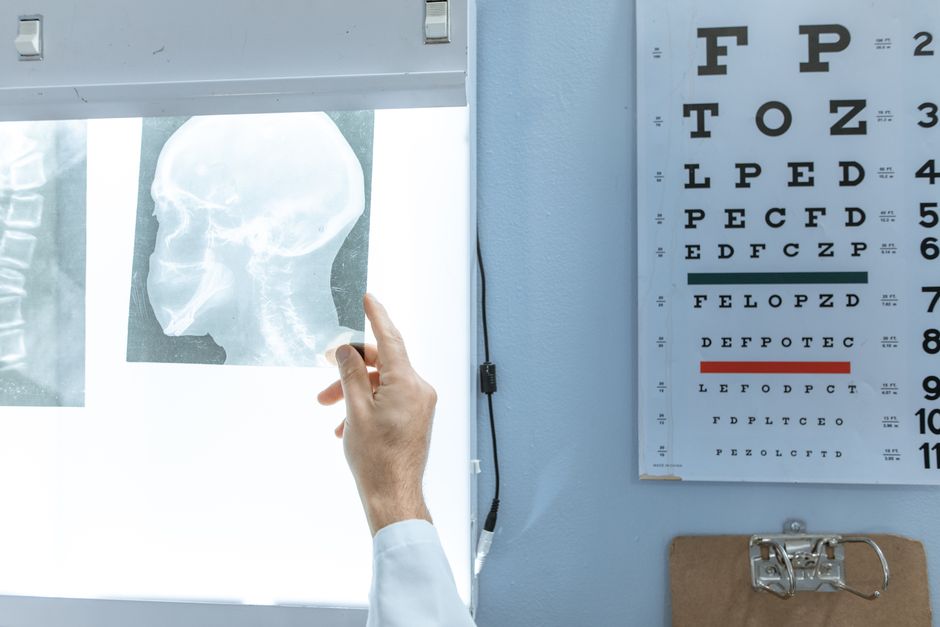
Converting Snellen visual acuity to LogMAR is a straightforward process once you know the formula. The LogMAR value equals the negative logarithm (base 10) of the decimal Snellen fraction. For example, 20/20 vision becomes a decimal of 1.0, and the negative log of 1.0 is 0. So 20/20 equals LogMAR 0.00. A line like 20/40 becomes 0.5 in decimal, and the negative log of 0.5 is approximately 0.30, giving a LogMAR of 0.30.
What Is the Difference Between Snellen and LogMAR?
Snellen charts have been the standard for measuring vision since the 1860s. You stand 20 feet from a chart and read letters that get progressively smaller. The result is a fraction — 20/20, 20/40, 20/200 — comparing your vision to what a person with typical vision can see at the same distance.
LogMAR stands for “logarithm of the minimum angle of resolution.” It was developed to fix a fundamental problem with Snellen charts: the letters on different lines are not equally difficult to read. The jump in size from one line to the next is inconsistent on a Snellen chart. This makes it hard to compare small changes in vision accurately.
LogMAR charts, by contrast, use a consistent geometric progression. Each line changes by a fixed ratio. There are also the same number of letters on each line (usually five), which controls for the fact that reading a line with more letters is harder than reading a line with fewer.
This matters more than most people realize. If a treatment improves your vision slightly, a Snellen chart might show no change at all because the lines jump too far apart. A LogMAR chart can detect that smaller improvement. That is why most clinical trials and research studies now use LogMAR as the primary measure.
How Do You Convert Snellen Fractions to LogMAR?
The conversion follows a consistent mathematical relationship. Here is the process step by step.
First, convert the Snellen fraction to a decimal. Divide the top number by the bottom number. For 20/20, that is 20 ÷ 20 = 1.0. For 20/40, it is 20 ÷ 40 = 0.5. For 20/200, it is 20 ÷ 200 = 0.1.
Second, take the logarithm (base 10) of that decimal. Third, reverse the sign (multiply by negative one).
The formula is: LogMAR = −log₁₀(decimal acuity)
When vision is better than 20/20 — say 20/16 — the decimal is 1.25, and the LogMAR becomes negative (−0.10). Negative LogMAR values represent vision better than the 20/20 reference standard. This is normal and expected. Many healthy young adults have LogMAR values slightly below zero.
When vision is worse than 20/20, LogMAR values are positive. A person with 20/200 vision has a LogMAR of 1.00, which represents significant visual impairment.
Snellen to LogMAR Conversion Table
This table shows the most commonly used conversions. All values are based on the standard formula and are consistent with published reference data.
| Snellen (feet) | Snellen (meters) | Decimal | LogMAR |
|---|---|---|---|
| 20/16 | 6/4.8 | 1.25 | −0.10 |
| 20/20 | 6/6 | 1.00 | 0.00 |
| 20/25 | 6/7.5 | 0.80 | 0.10 |
| 20/30 | 6/9 | 0.67 | 0.18 |
| 20/40 | 6/12 | 0.50 | 0.30 |
| 20/50 | 6/15 | 0.40 | 0.40 |
| 20/60 | 6/18 | 0.33 | 0.48 |
| 20/70 | 6/21 | 0.29 | 0.54 |
| 20/80 | 6/24 | 0.25 | 0.60 |
| 20/100 | 6/30 | 0.20 | 0.70 |
| 20/200 | 6/60 | 0.10 | 1.00 |
| 20/400 | 6/120 | 0.05 | 1.30 |
Note that the LogMAR scale is linear. A change of 0.10 in LogMAR corresponds to one line on a standard LogMAR chart. This makes it easy to express treatment effects. If a study reports a mean improvement of 0.15 LogMAR, that means the average participant gained about one and a half lines of vision.





How Do You Convert LogMAR Back to Snellen?
The reverse conversion uses the same relationship rearranged. If you know the LogMAR value, you can find the decimal acuity and then the Snellen fraction.
The formula is: Decimal acuity = 10^(−LogMAR)
For a LogMAR of 0.30, the decimal is 10^(−0.30), which equals approximately 0.50. That corresponds to 20/40. For a LogMAR of 1.00, the decimal is 10^(−1.00) = 0.10, which is 20/200.
To get the Snellen fraction from the decimal, divide 20 by the decimal. If the decimal is 0.50, then 20 ÷ 0.50 = 40, giving 20/40. If the decimal is 0.10, then 20 ÷ 0.10 = 200, giving 20/200.
One practical note: Snellen fractions are usually rounded to standard values. If you calculate a decimal of 0.63, the nearest standard Snellen line is 20/32, but most charts do not have a 20/32 line. In practice, you would report the closest line the person could read. LogMAR avoids this rounding problem entirely because it is a continuous scale.
Why Does LogMAR Matter for Eye Care and Research?
LogMAR has become the preferred measure in clinical research for several reasons that are well established in the vision science literature.
- Equal step sizes: Each line on a LogMAR chart represents the same proportional change in letter size. On a Snellen chart, the steps are uneven.
- Standardized letter count: LogMAR charts typically have five letters per line. Snellen charts vary from one to eight or more letters per line, which affects how easy or hard a line is to read.
- Statistical analysis: Because LogMAR is on a logarithmic scale, it behaves better in statistical tests. Averaging Snellen fractions (like 20/40 and 20/100) produces meaningless numbers. Averaging LogMAR values is mathematically valid.
- Sensitivity to change: LogMAR can detect smaller changes in vision than Snellen, which matters when evaluating whether a treatment is working.
This does not mean Snellen charts are useless. They remain the standard in most eye doctors’ offices because they are familiar, quick, and adequate for routine vision screening. The conversion between the two is mainly needed when reading research, comparing results across studies, or when a specialist records vision in LogMAR for a specific clinical purpose.
What About Other Visual Acuity Notations?
Snellen and LogMAR are not the only systems in use. You may encounter several others, and knowing how they relate helps avoid confusion.
Metric Snellen (6/6): This is the same as 20/20 but expressed in meters instead of feet. The conversion is direct: 20 feet equals approximately 6 meters. So 20/20 = 6/6, 20/40 = 6/12, and so on. The decimal and LogMAR values are identical regardless of whether the fraction is in feet or meters.
Decimal notation: Common in Europe and Australia. Instead of 20/20, they write 1.0. Instead of 20/40, they write 0.5. The decimal is simply the first step in the LogMAR conversion.
ETDRS charts: The Early Treatment Diabetic Retinopathy Study chart is a specific LogMAR chart design. It uses a standardized layout with five letters per line and a precise geometric progression. When a study reports “ETDRS letters,” it is using a LogMAR-based system. Each line has five letters, so a change of five letters equals 0.10 LogMAR.
Counting fingers, hand motion, light perception: These are used when vision is too poor to read any letters on a chart. They do not convert to LogMAR through a formula. Some researchers assign approximate LogMAR values for statistical purposes — counting fingers is sometimes given a value around 2.0 or higher — but these are conventions, not true conversions. The evidence for specific assigned values is limited, and different studies may use different conventions.
What Are the Limitations of Converting Between These Scales?
The mathematical conversion is exact. The clinical interpretation is not always straightforward.
Snellen and LogMAR charts test vision under different conditions. Letter spacing, letter difficulty, chart lighting, and testing distance can all affect the result. A person who reads 20/40 on a Snellen chart might read a slightly different LogMAR value on an ETDRS chart on the same day. The conversion formula gives you the mathematical equivalent, but it does not guarantee the two tests would produce identical results in a real clinical setting.
Also, visual acuity is just one measure of vision. It tells you how well someone can see high-contrast letters at a distance. It says nothing about contrast sensitivity, peripheral vision, color vision, or how well someone functions in daily life. Two people with the same LogMAR score can have very different real-world visual experiences.
For research purposes, LogMAR is the better choice because it is more precise and statistically sound. For routine clinical use, the conversion is most helpful when you need to compare a Snellen measurement to a LogMAR value reported in a study or when a specialist uses both systems in the same record.
Frequently Asked Questions
What is 20/20 vision in LogMAR?
20/20 vision equals LogMAR 0.00. This is because 20/20 converts to a decimal acuity of 1.0, and the negative logarithm of 1.0 is zero.
How do you convert 20/40 to LogMAR?
20/40 converts to LogMAR 0.30. Divide 20 by 40 to get 0.5, then take the negative log base 10 of 0.5, which is approximately 0.30.
Can LogMAR values be negative?
Yes. Negative LogMAR values indicate vision better than 20/20. For example, 20/16 vision equals approximately −0.10 LogMAR.
Is LogMAR better than Snellen for measuring vision?
LogMAR is more precise and is preferred in clinical research because it uses equal step sizes and a consistent letter count per line. Snellen remains common in routine eye exams because it is familiar and quick.
